
The Dashboard brings LinkedIn Ads, Google Ads and Meta Ads together on one screen: spend, impressions, clicks, conversions and leads, compared with the previous period. Here is how to read each section and how to filter.
- Where: Dashboard menu
- Requires: at least one connected ad network
- Who sees it: every access level
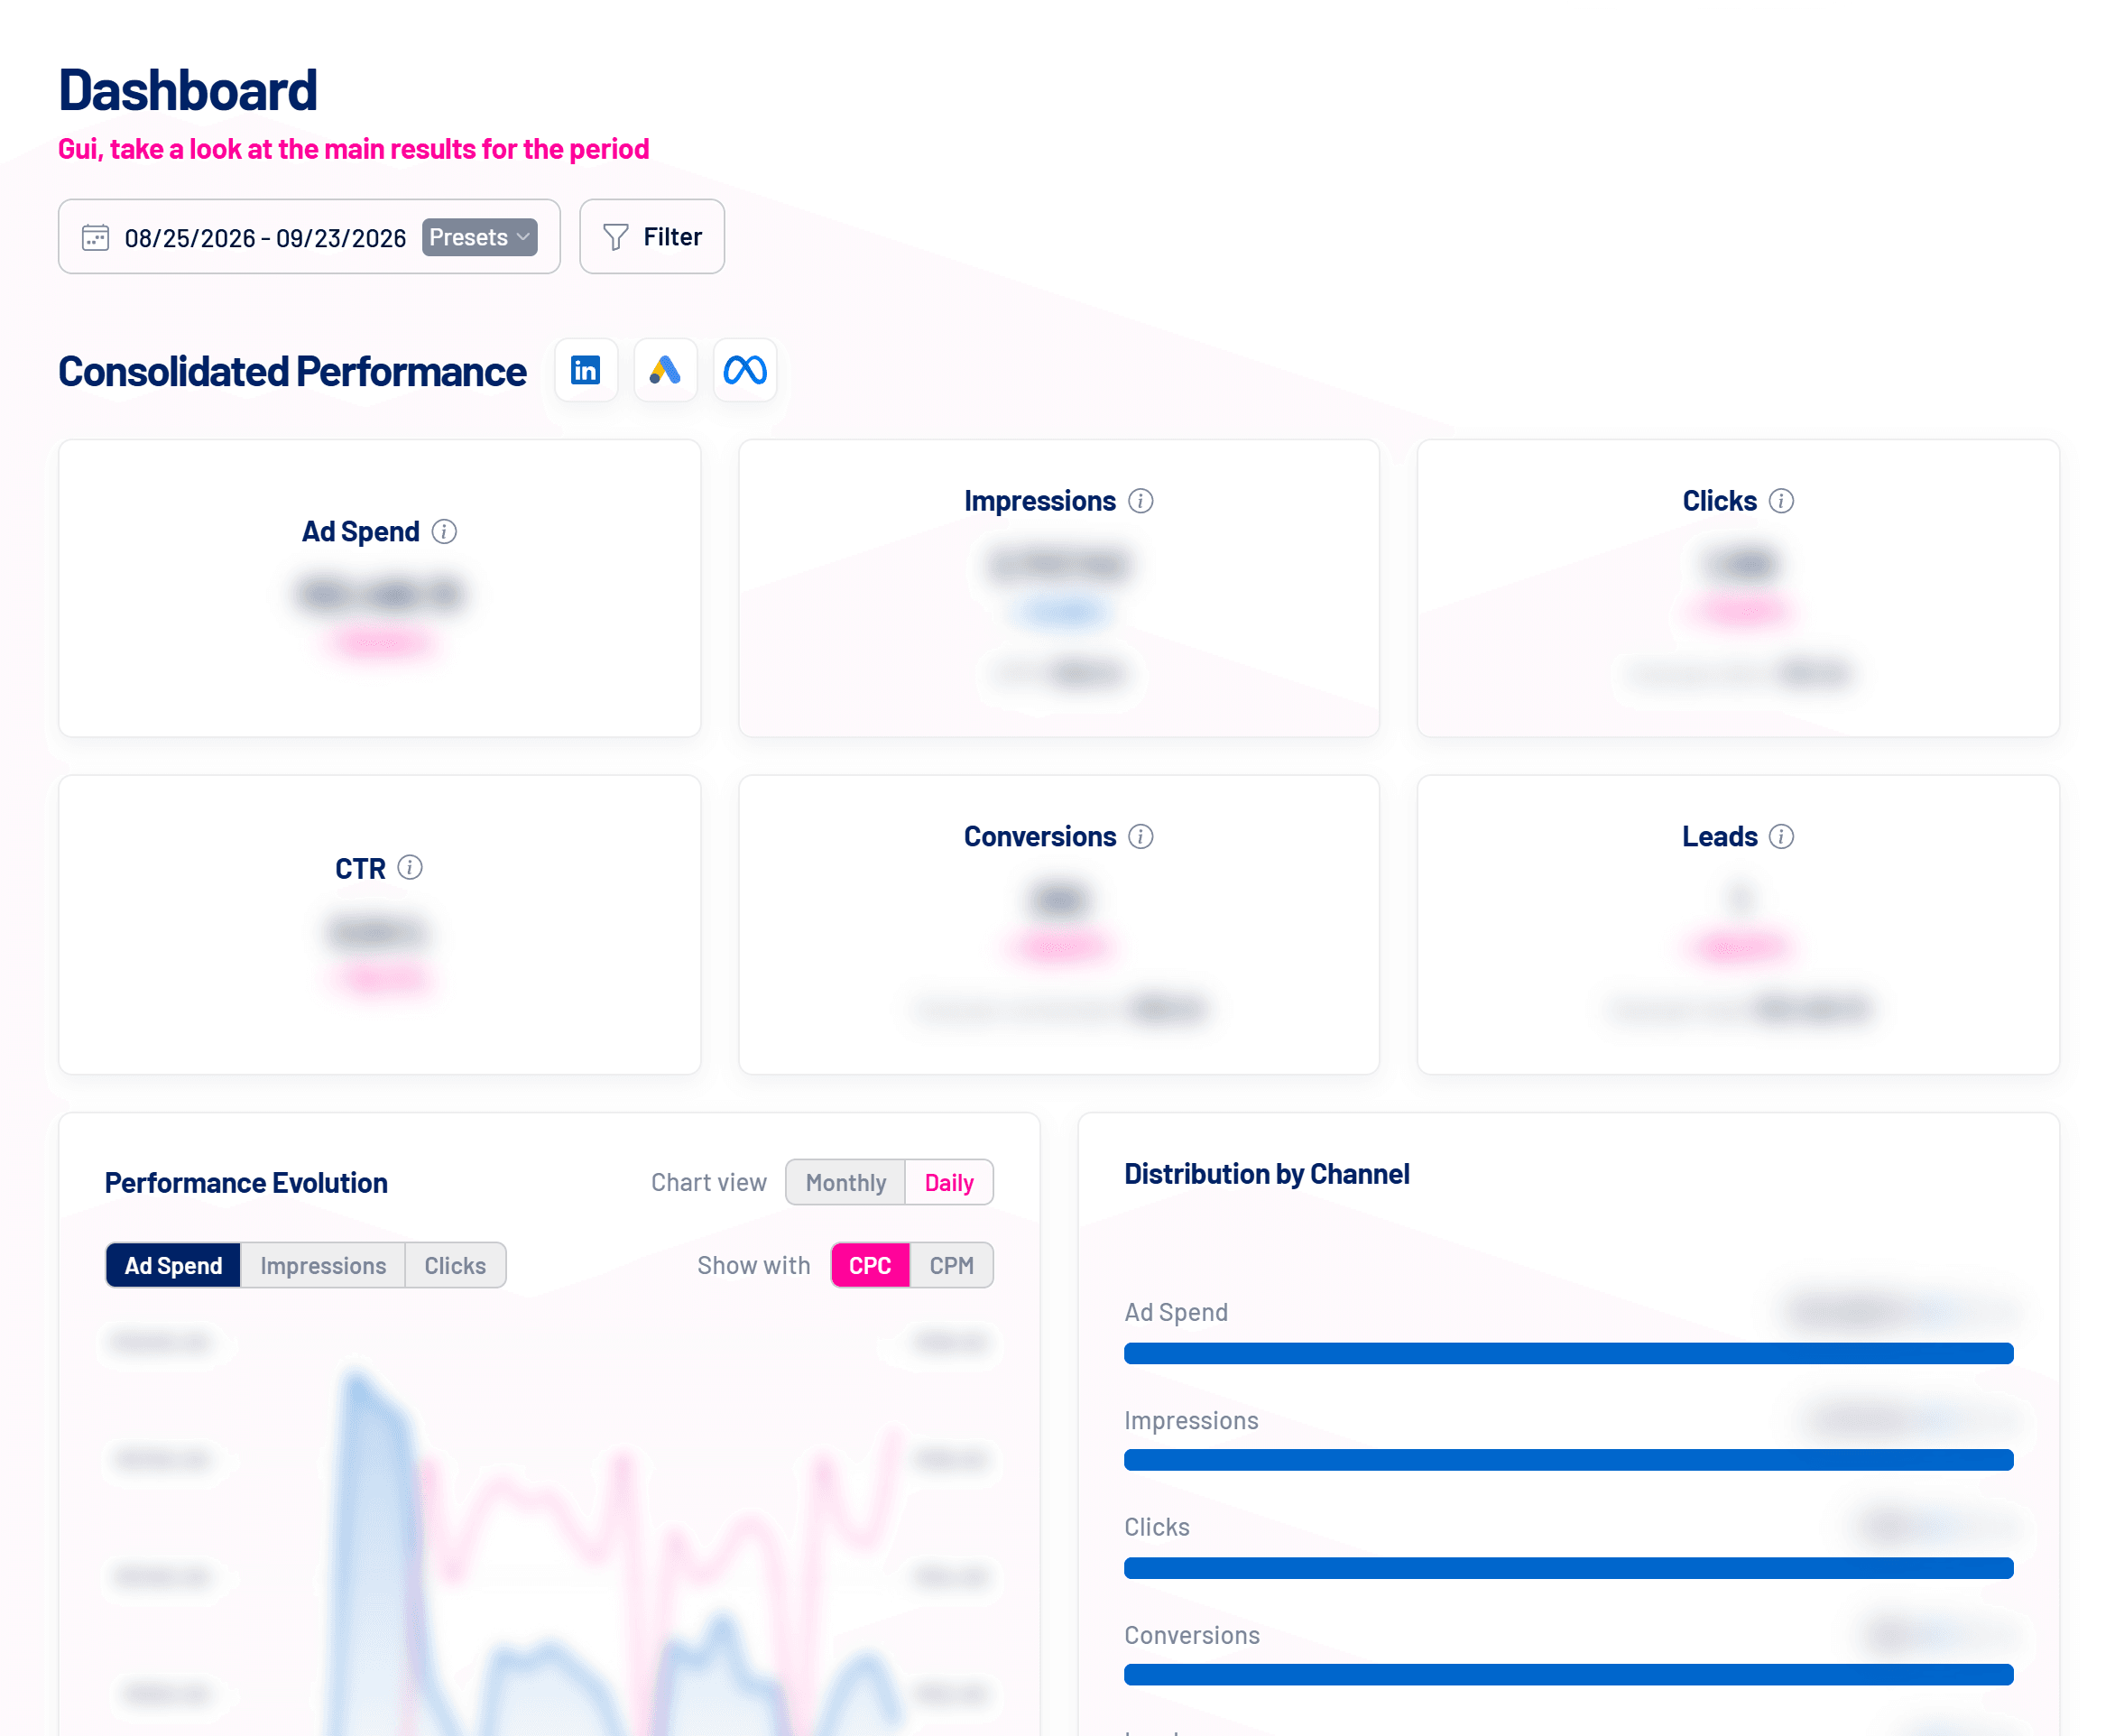
Consolidated Performance
The six cards add up the selected networks: Ad Spend, Impressions, Clicks, CTR, Conversions and Leads. Below each number is the change versus the previous period of the same length, plus the derived cost (CPM, cost per click, per conversion and per lead).
- Network icons: next to the title, click a network’s icon to remove it from the total or add it back. A network that isn’t connected takes you to the integrations.
- Icon in alert colors: the network didn’t respond. If the hint says access expired, click to reconnect.
- Different currencies: if the accounts use different currencies, consolidated spend and costs aren’t added up. Select only networks in the same currency to see the total.
- Dash (–) and zero: a dash means the network had no delivery in the period. Zero only shows when the value really is zero.
Performance Evolution and Distribution by Channel
The evolution chart shows spend, impressions or clicks by day or month, with the CPC or CPM line on top. Distribution by Channel shows each network’s share of the total. A network that started advertising mid-period rises from zero.
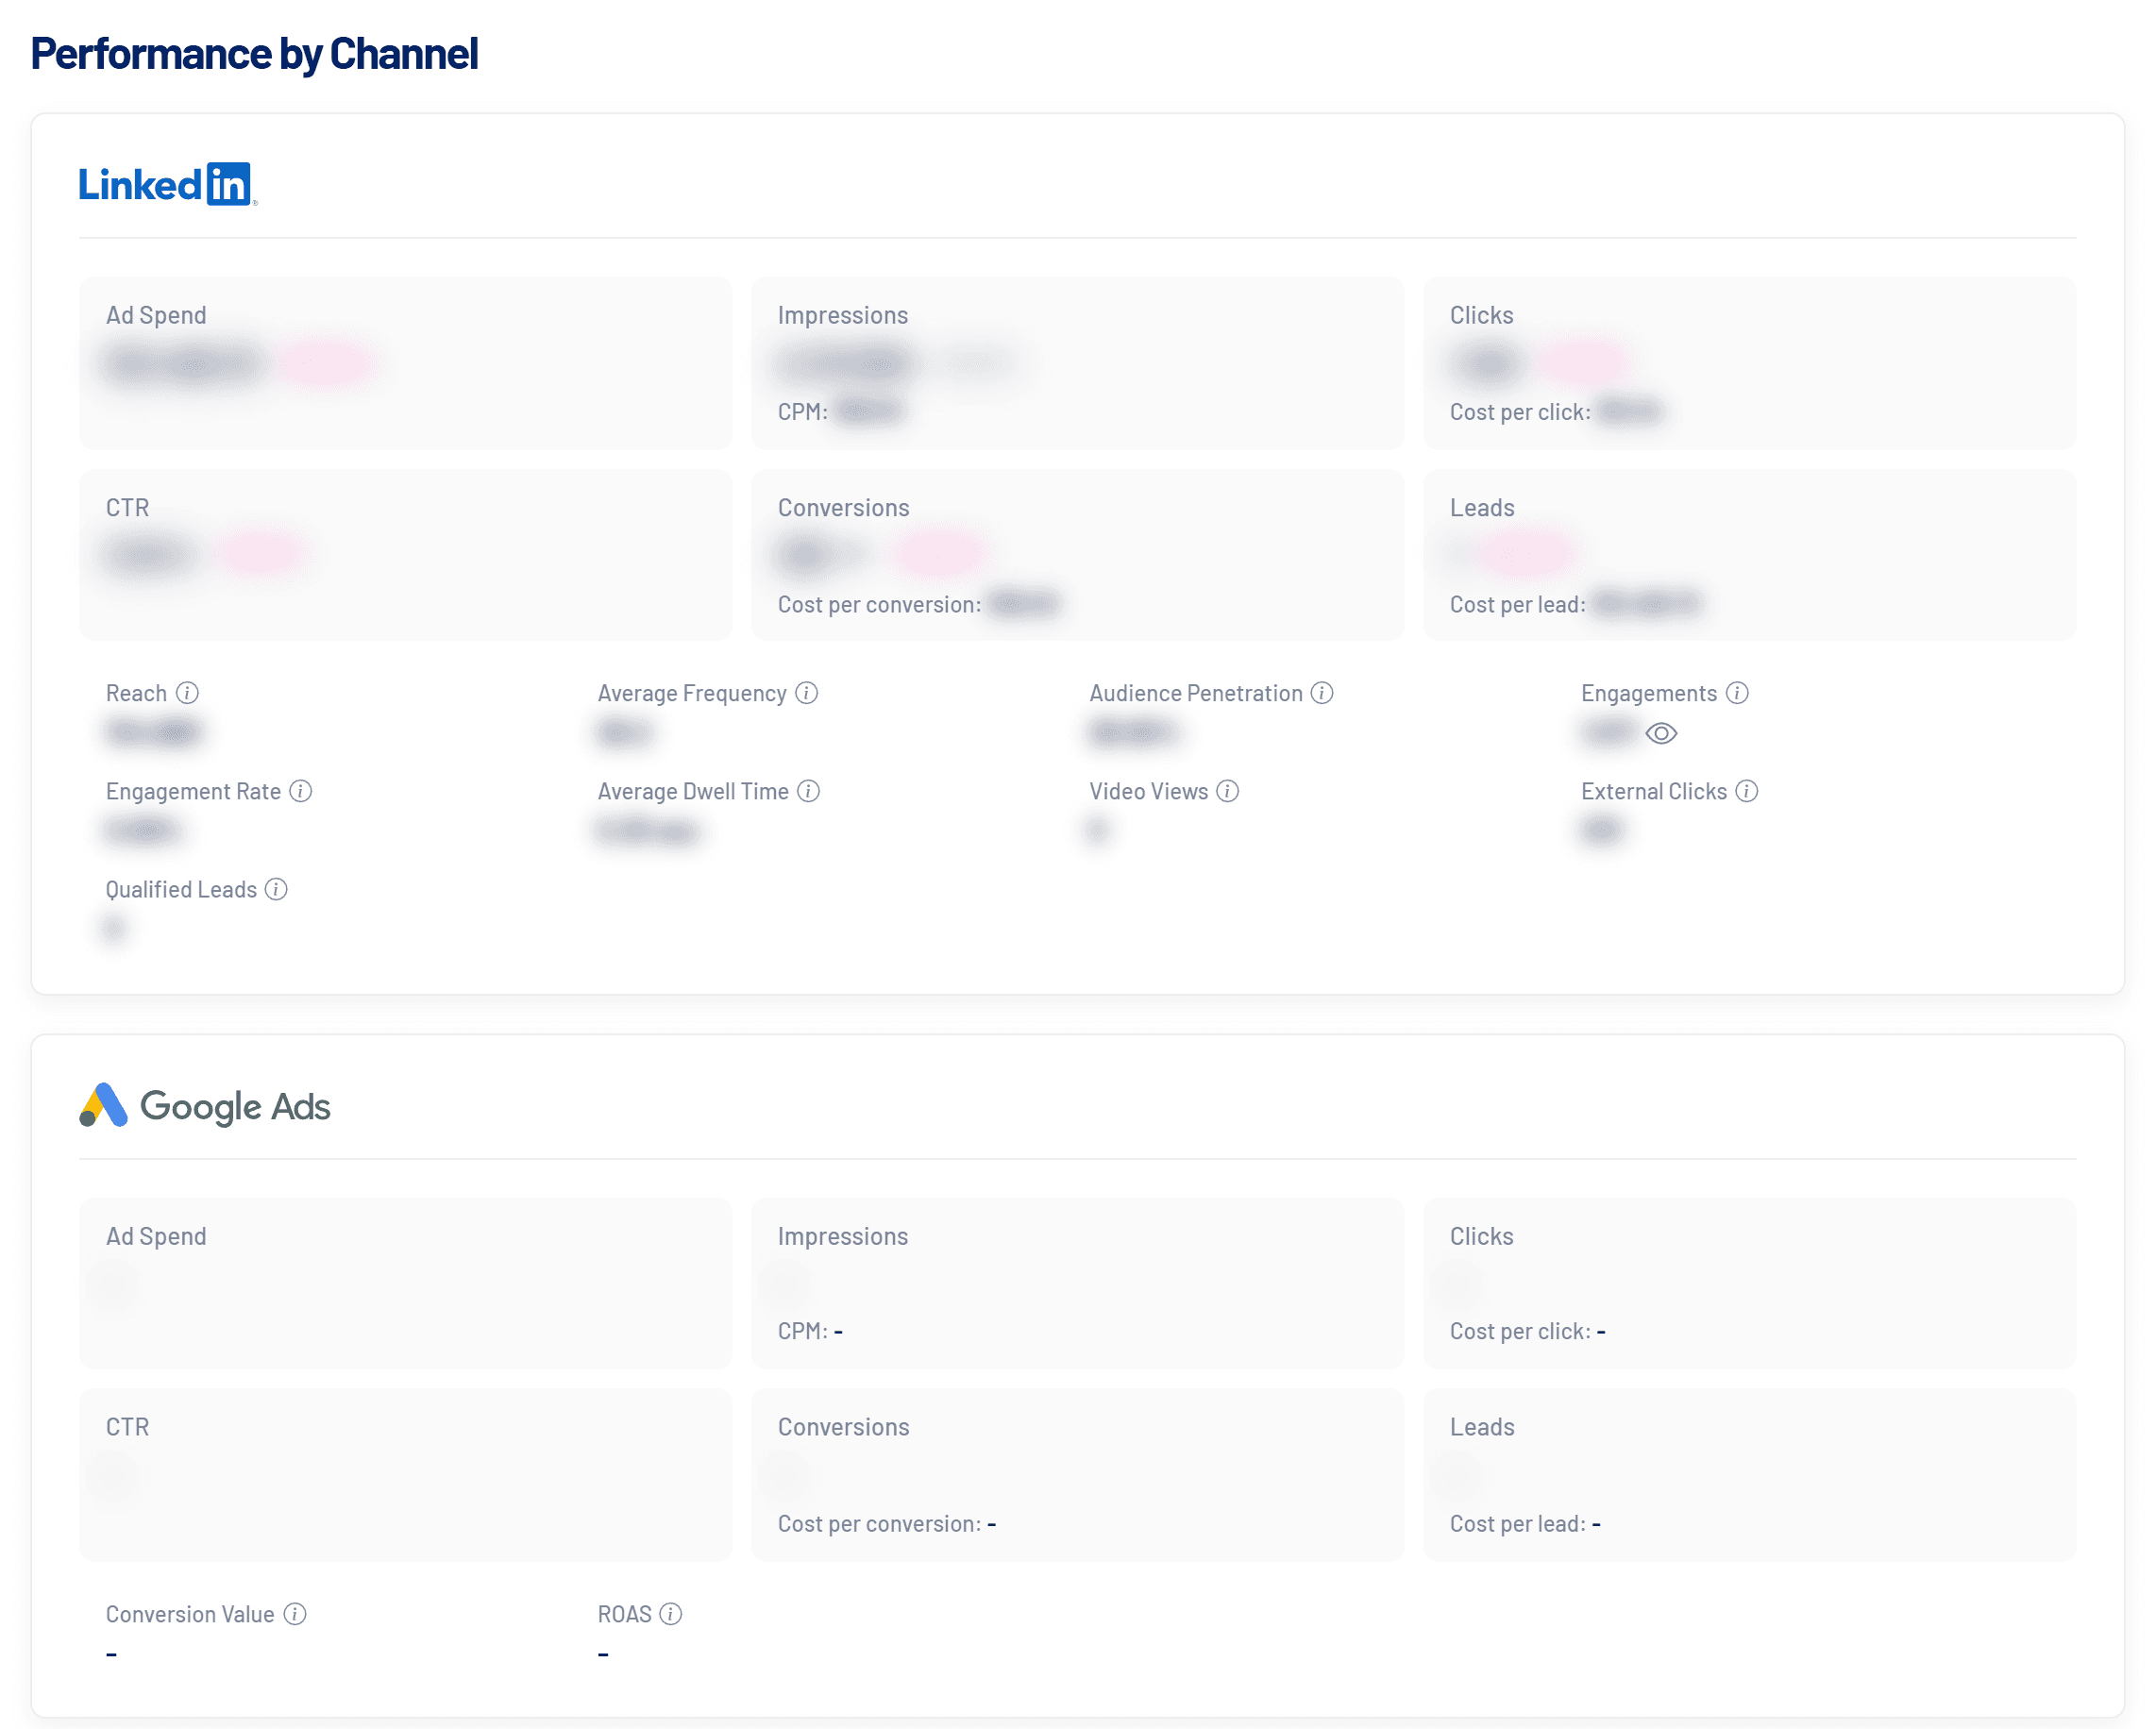
Performance by Channel
| Network | Exclusive metrics |
|---|---|
| LinkedIn Ads | Reach, average frequency, audience penetration, engagements, engagement rate, average dwell time, video views, external clicks and qualified leads. |
| Google Ads | Conversion value and ROAS. |
| Meta Ads | Reach, frequency and landing page views. |
On Conversions and Engagements, the eye icon opens the breakdown by type. See how each metric is calculated in How LinkedScope calculates metrics.
Top Ads and Top Companies
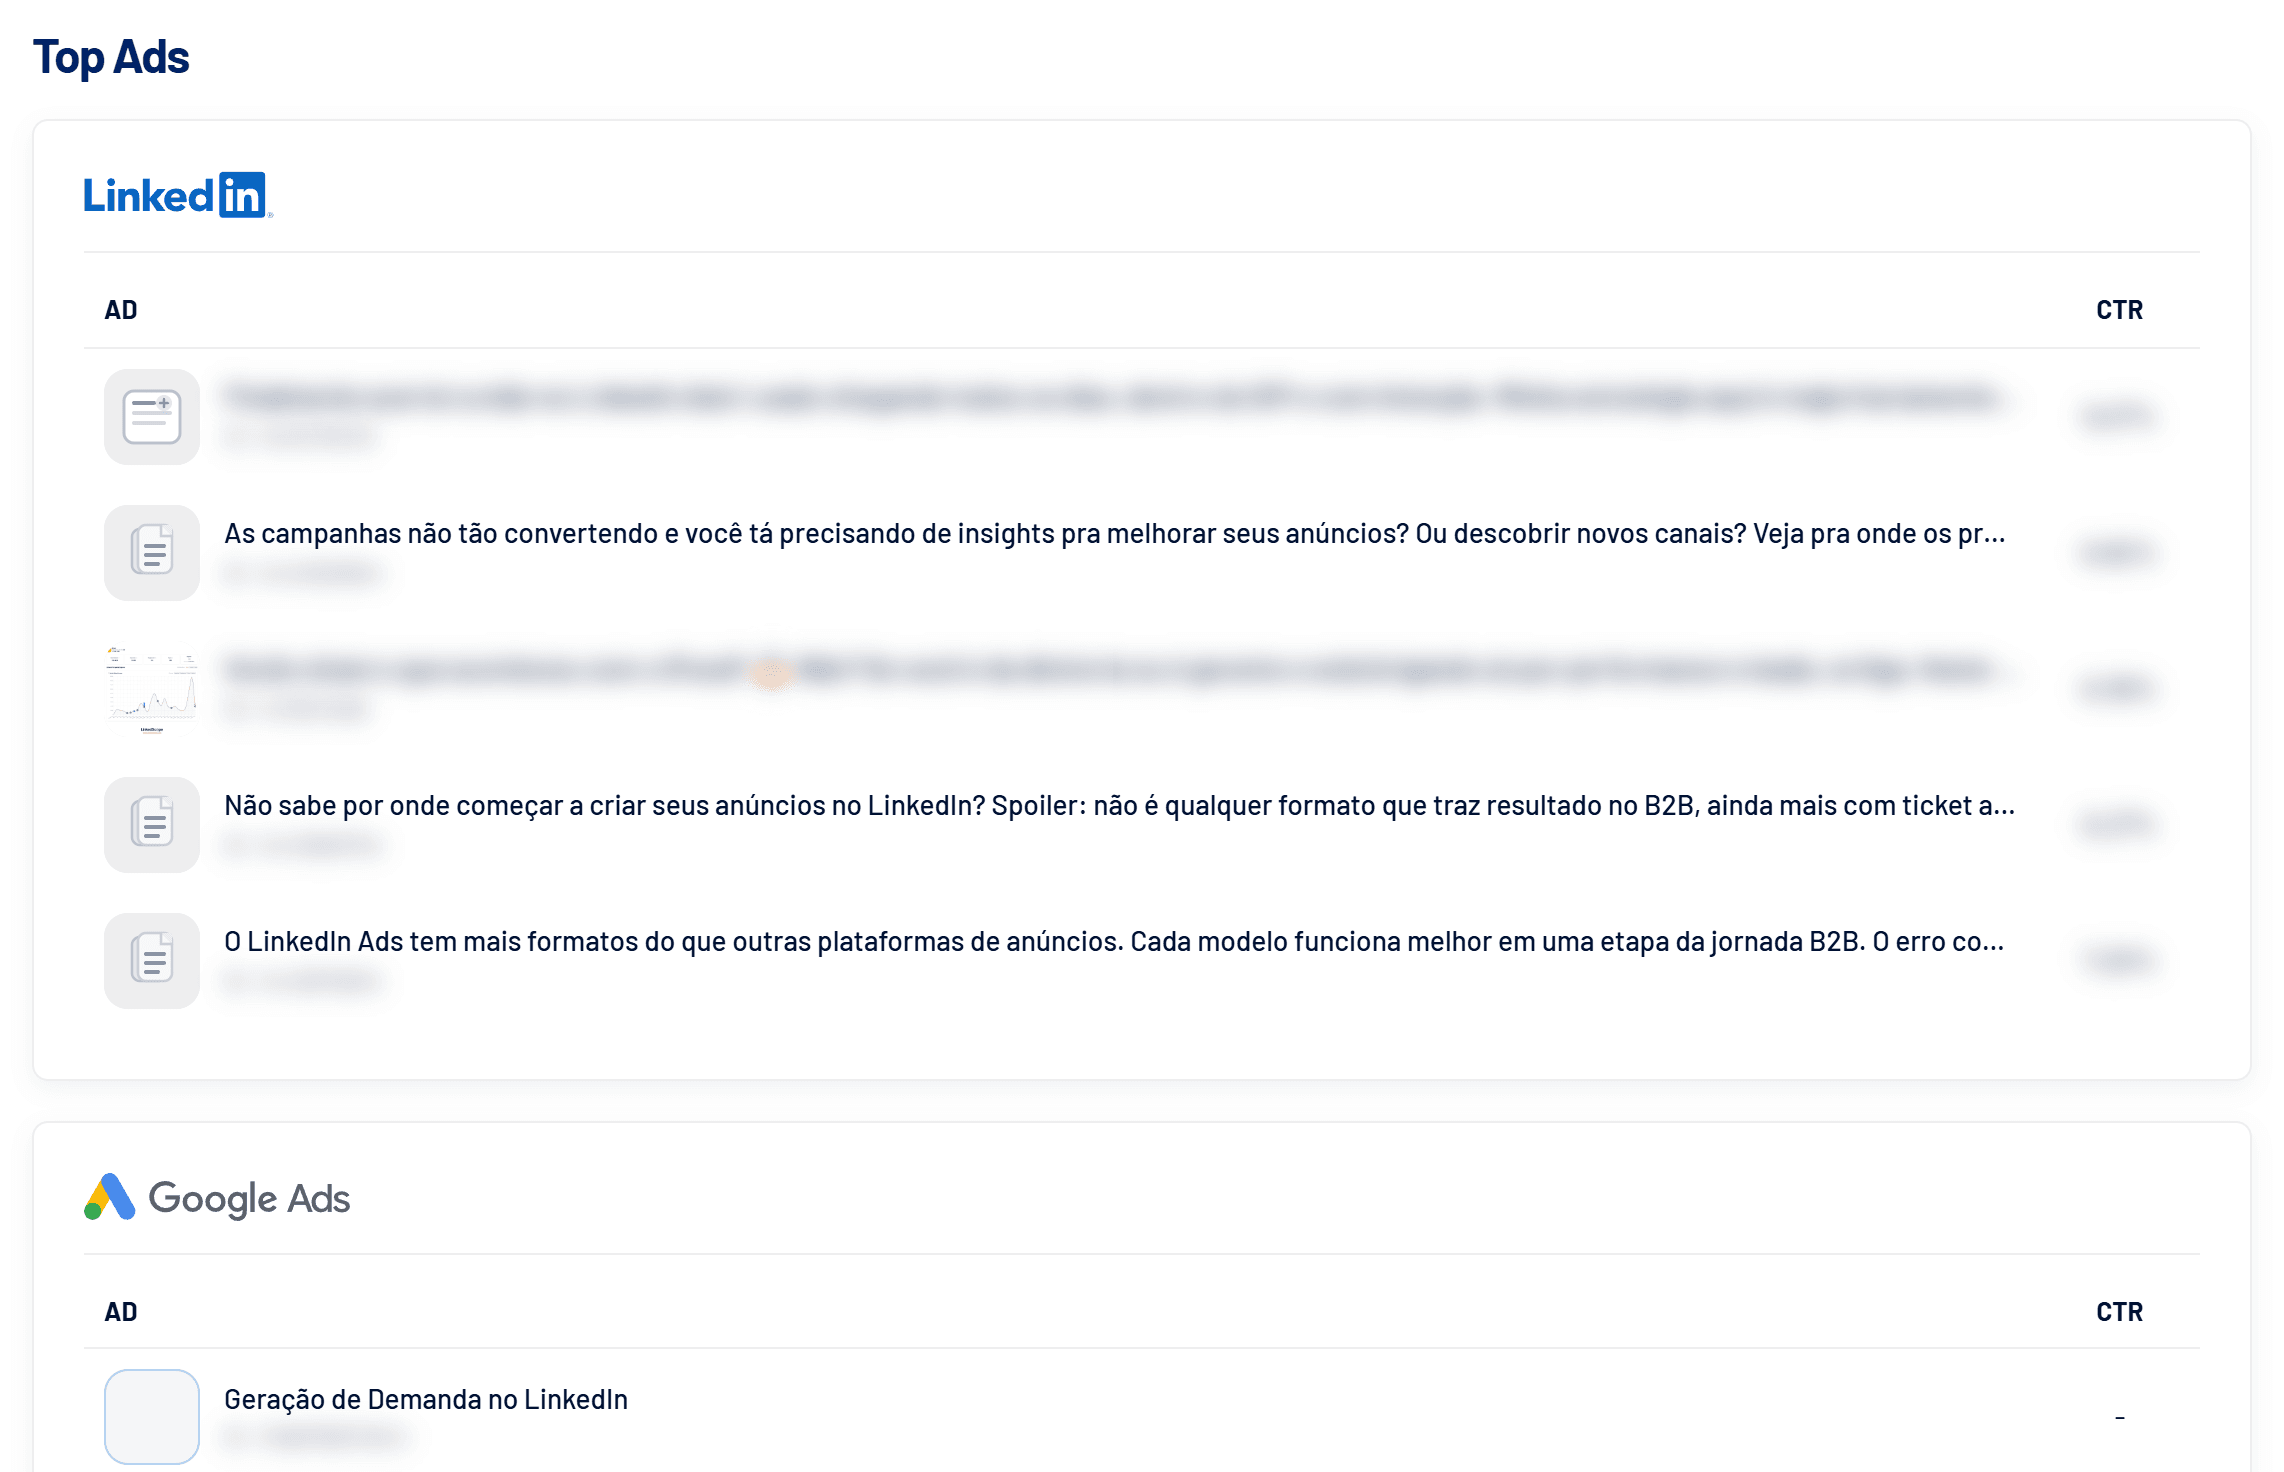
Top Ads lists up to five ads per network, sorted by conversions and then by CTR. Google Performance Max campaigns have no ad-level data.
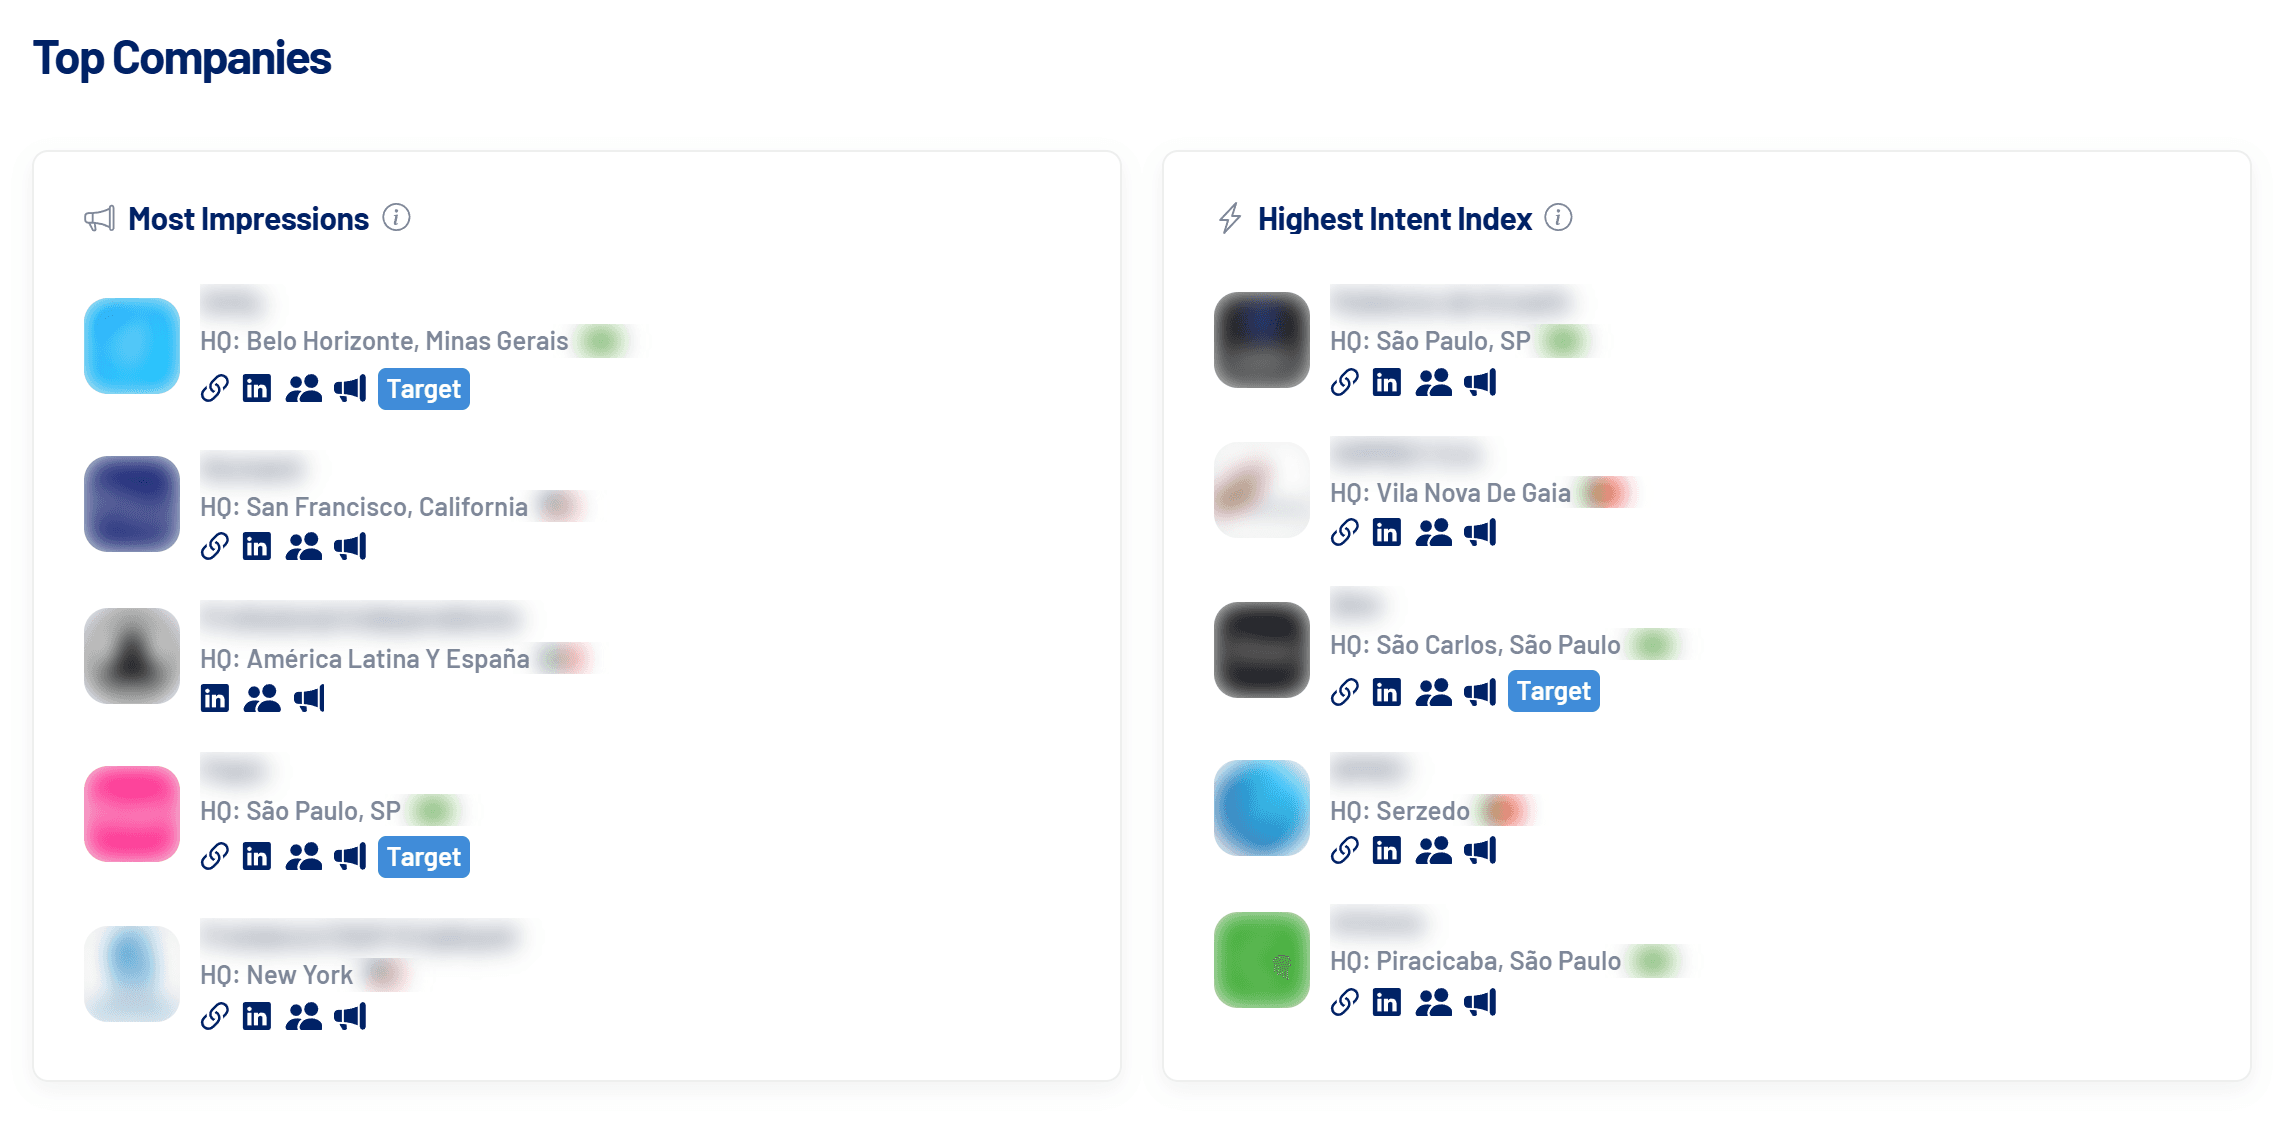
Top Companies shows the companies reached on LinkedIn with the most impressions and the highest Intent Index. The Target tag marks the ones in your Target Accounts. See Reached Companies: how it works.
LinkedIn-only sections
- Audience Demographic Analysis: spend, impressions and rates by job function, seniority, industry and other breakdowns. LinkedIn keeps this data for two years.
- LinkedIn Company Page Analytics: organic followers, visitors, impressions and engagements for the last 365 days. The user who connected LinkedIn needs at least Analyst permission on the Page.
How to filter by campaign
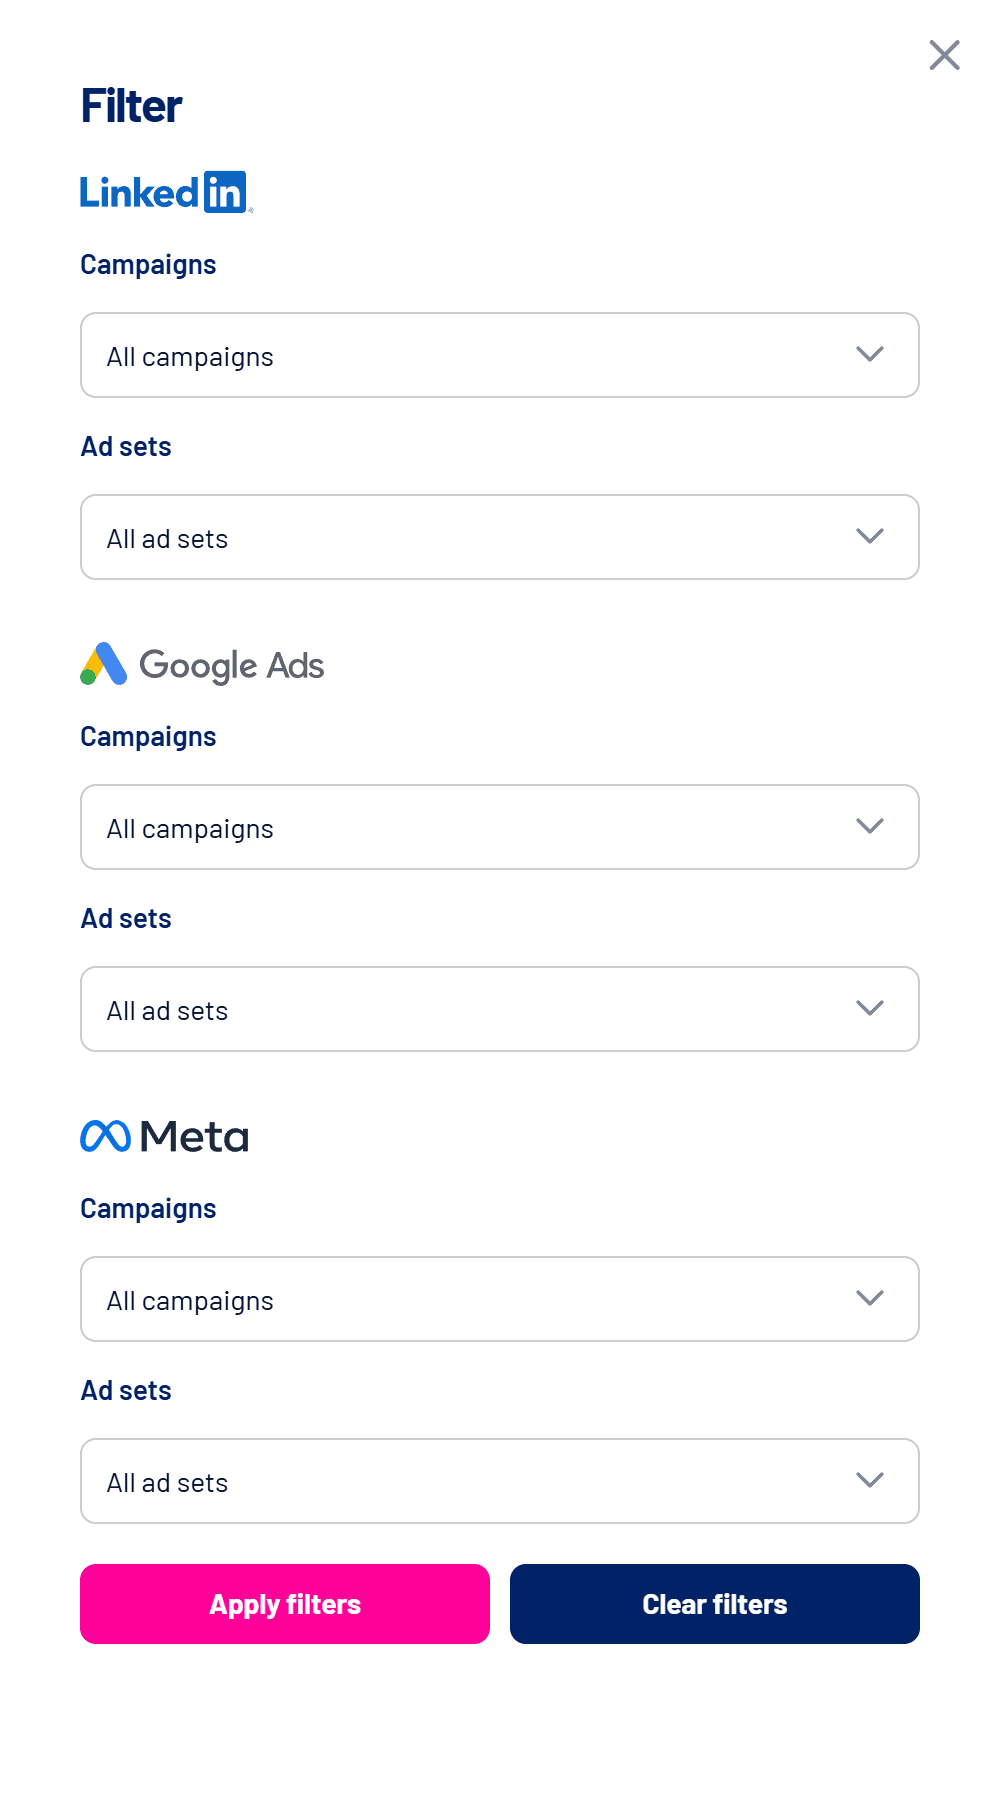
- Click Filter
The panel shows, for each connected network, the lists of campaigns and ad sets. - Choose what you want to see
Leave it blank to include everything from that network. - Click Apply filters
To see everything again, use Clear filters.
Leads with a campaign filter
With a campaign filter on, website leads aren’t counted, because form UTMs can’t identify campaigns accurately. Native form leads still show up.
Frequently asked questions
Why does the lead count differ from what I see on each network?
LinkedScope separates native form leads (reported by the network) from website leads attributed to the network by click ID or UTMs, so the same person is never counted twice. See How LinkedScope calculates metrics.
Why is there no comparison with the previous period?
For periods longer than one year, the comparison is turned off: the previous period usually has no data.
How do I choose the period?
With the date picker at the top. See Date range filter: presets and All time.